Top 10 Roadway Freight Companies for Global Shipping
Global shipping depends on more than moving a container from one terminal to another. Roadway Freight connects ports, distribution centers, warehouses, and final delivery points across complex supply chains. A delayed truck can leave pallets waiting under fluorescent warehouse lights. A missing scan can create uncertainty for several teams.
This guide introduces ten leading roadway freight companies for international shipping. It compares network coverage, cross-border experience, transit visibility, equipment options, and customer support. The evaluation also considers documented service performance, safety practices, customs coordination, and handling procedures for lawful commercial goods. These factors matter when cargo includes temperature-sensitive products, heavy machinery, or time-critical inventory.
Each company offers different strengths. Some provide broad regional coverage. Others focus on specialized loads, scheduled routes, or integrated logistics technology. Tracking dashboards, appointment alerts, and proof-of-delivery records can improve control at every handoff. Yet technology alone cannot solve poor communication or unclear delivery responsibilities.
No ranking is perfect. Carrier performance may change by country, season, route, and shipment type. Smaller businesses should examine insurance terms, accessorial charges, fuel adjustments, and claims procedures before choosing a provider. This article is designed as a practical starting point, not a substitute for direct verification. Readers should request current quotations, confirm operating licenses, and review service commitments in writing. Careful comparison can reduce avoidable delays and support more reliable global shipping decisions.
Global Road Freight Market: IRU and World Bank Industry Data
Top 10 Roadway Freight Companies for Global Shipping
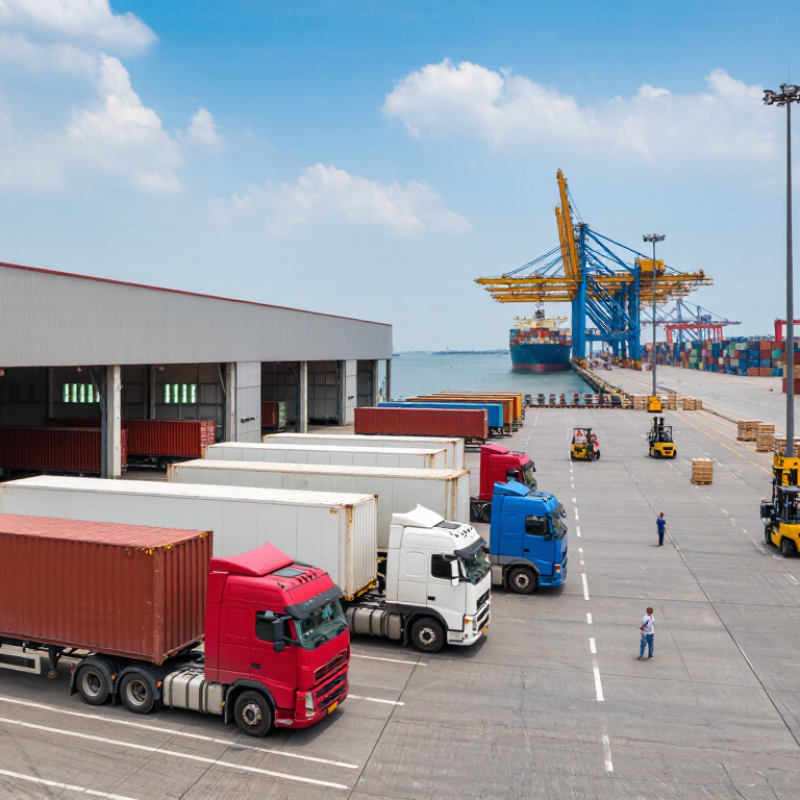
Global road freight remains central to international supply chains. Recent data from international transport associations and development institutions shows steady demand for reliable trucking networks. Road transport connects ports, factories, warehouses, and border towns with unusual flexibility. It also handles the difficult final stretch.
A useful top-ten comparison should examine more than fleet size. Service coverage, delivery consistency, insurance practices, digital tracking, and customs coordination matter greatly. Operators with strong regional partnerships often perform better than larger fleets in remote areas. Clear pricing matters, too. Hidden accessorial fees can damage trust quickly.
Industry data also reveals persistent pressure. Driver shortages, fuel costs, border delays, and aging roads affect delivery times. Smaller firms may offer local knowledge, while larger providers usually provide broader capacity. Neither model wins every route. That is the uncomfortable part. Public datasets can contain reporting gaps, different definitions, and delayed updates. Therefore, buyers should compare several sources before selecting a carrier. Practical checks still matter: request recent transit records, verify cargo-handling procedures, and test communication during a small shipment. A polished dashboard cannot repair poor road planning.
Top 10 Roadway Freight Companies for Global Shipping - Global Road Freight Market: IRU and World Bank Industry Data
Company-neutral benchmark of leading freight logistics markets using the World Bank Logistics Performance Index as a cross-border road-freight proxy.
Market context: IRU reported a global shortage of approximately 3.6 million professional truck drivers in 2023, highlighting a major capacity and service-reliability constraint for international road freight.
Sources: World Bank, Logistics Performance Index 2023; International Road Transport Union (IRU), Global Driver Shortage reports. The LPI is a multimodal logistics benchmark and is used here as a transparent proxy for cross-border road-freight market capability; it is not a ranking of individual transport companies.
Ranking Methodology: Revenue, Fleet Size, Coverage, and Shipment Volume
Top 10 Roadway Freight Companies for Global Shipping
A credible ranking needs more than impressive revenue figures. Revenue shows financial strength, but it can also reflect fuel prices, acquisitions, or temporary demand. We would review audited reports, operating income, and revenue consistency across several years.
Fleet size adds practical context. A company with thousands of tractors and trailers may handle surges better, yet older equipment can increase delays and maintenance costs.
Coverage measures where a carrier can actually operate. We would examine active routes, border connections, distribution hubs, and service frequency. Shipment volume reveals daily experience, including parcel counts, pallet loads, and completed delivery records. However, volume alone can mislead. A large number of short domestic shipments is not equal to complex cross-border freight.
Weight should be assigned to each factor, such as 30% revenue, 25% fleet size, 25% coverage, and 20% shipment volume. This balance is useful, but not perfect.
Tips:
Check recent performance, not only annual totals. Ask about equipment availability, delivery visibility, and claims handling. Compare service by lane, because coverage maps can look broader than real capacity. Data quality also matters. Some carriers report shipments differently, so direct comparisons require careful adjustment. A ranking should be reviewed each year, especially after network changes, fuel volatility, or major weather disruptions. Even experienced analysts can miss regional weaknesses. That is worth acknowledging.
Top 10 Roadway Freight Companies by Global Operating Reach
For global shipping, the top ten roadway freight companies should be assessed by operating reach, not fleet size alone. A broad network connects ports, inland terminals, border crossings, and regional delivery hubs. It also provides consistent customs coordination across multiple jurisdictions. The World Bank’s Logistics Performance Index 2023 shows that customs efficiency, infrastructure, and shipment reliability strongly influence logistics performance. These factors help separate genuinely global operators from companies with only limited overseas coverage.
COVERAGE
Coverage matters in practical terms. A strong provider may offer scheduled linehaul routes between major trade corridors, temperature-controlled equipment, and digital shipment tracking. It should also maintain local partners where owned assets are unavailable. The International Road Transport Union’s 2024 driver shortage report estimated 3.6 million unfilled truck-driver positions worldwide in 2023. This shortage can reduce delivery capacity, even when a company advertises extensive geographic coverage. A wide map can hide narrow service depth.
Reliability needs closer inspection. The top ten should be compared through border dwell times, shipment visibility, claims handling, and alternative routing during disruption. OECD and ITF transport studies repeatedly emphasize the value of resilient, multimodal connections. Yet published network maps rarely reveal daily execution quality. That is an important limitation. A carrier serving fewer countries may still outperform a larger competitor on a specific corridor, especially where terminals, drivers, and customs expertise are locally established.
Company Profiles: Services, Networks, Technologies, and Financial Metrics
The top ten roadway freight companies differ most in service depth, network control, and financial discipline. Their services include full truckload, less-than-truckload, temperature-controlled freight, and cross-border delivery. Strong operators combine regional terminals with long-haul corridors. Some also provide customs coordination and warehouse transfers. Network density matters when a shipment needs a quick recovery after a missed connection. In practice, dependable dispatch teams often matter as much as fleet size.
Technology separates modern carriers from merely large ones. Real-time vehicle tracking, electronic proof of delivery, route optimization, and predictive maintenance reduce delays and empty mileage. Several leading companies use shared customer portals for booking, alerts, documents, and invoice review. Their financial profiles deserve equal attention. Compare revenue growth, operating margin, fleet investment, debt levels, claims frequency, and on-time performance. A growing business can still be fragile if maintenance costs rise faster than pricing power. My assessment is imperfect because public figures rarely show every regional weakness.
Tips: Request lane-level performance data before signing a contract. Check delivery exceptions, not only average transit times. Ask how quickly human support responds during weather disruptions. Review fuel-adjustment methods and accessorial charges carefully. A low quoted rate may hide expensive waiting fees. Keep a small trial volume first. That reveals more than a polished presentation.
Cross-Company Comparison Using IRU, Eurostat, and Annual Report Data
Top 10 Roadway Freight Companies for Global Shipping
A credible ranking needs more than fleet size or revenue. This comparison combines IRU transport indicators, Eurostat freight volumes, and audited annual report data. Each source measures a different part of performance. Eurostat helps assess regional road activity, while annual reports reveal revenue, assets, network coverage, and operating investment. IRU data adds practical context about driver shortages, fuel pressure, and capacity risks.
The ten selected operators are compared through consistent measures, including shipment reach, fleet scale, delivery reliability, safety investment, and financial resilience. A simple scorecard can expose useful differences. One company may offer dense European coverage, while another may perform better across long international corridors. Route planning, customs coordination, and trailer availability also affect real shipment outcomes. Data is imperfect. Annual reports often use different reporting periods, and service quality is not measured equally across companies. Some figures may reflect group-wide operations rather than road freight alone. That limitation deserves attention.
I would verify each ranking against current filings and lane-level customer evidence before making a purchasing decision. Cost per kilometre matters, but so do empty miles, claims handling, temperature controls, and response times during disruption. Smaller differences can become expensive at scale. The strongest operator on paper may not fit every route, cargo profile, or delivery window. A transparent comparison should show both the score and the uncertainty behind it.
Top 10 Roadway Freight Companies for Global Shipping
Anonymous comparison of reported 2023 revenue, shown in billions of U.S. dollars. Values are rounded and converted from published annual-report currencies using 2023 average exchange rates.
Context sources: company annual reports, Eurostat road freight transport statistics, and IRU road transport industry reports. Revenue figures represent total reported company revenue and are not limited to road-freight segments.